doi: 10.56294/evk202367
ORIGINAL
Impacts of Particulate Matter (PM 2.5) on the atmospheric quality of the District of Morales - Province of San Martin – 2022
Impactos de Material Particulado (PM 2.5) en la calidad atmosférica del Distrito de Morales – Provincia de San Martin – 2022
Rodrigo
Dávid Colichón Carranza1 ![]() *,
Alexis Torres-del Aguila1 *, Carlos Mauricio Lozano Carranza1
*,
Alexis Torres-del Aguila1 *, Carlos Mauricio Lozano Carranza1 ![]() *,
Andi Lozano Chung2
*,
Andi Lozano Chung2 ![]() *
*
1Universidad César Vallejo, Facultad De Ingeniería Y Arquitectura. Tarapoto, Perú.
2Universidad Nacional de San Martín. Tarapoto, Perú.
Cite as: Colichón Carranza RD, Torres-del Aguila A, Lozano Carranza CM, Lozano Chung A. Impacts of Particulate Matter (PM 2.5) on the atmospheric quality of the District of Morales - Province of San Martin – 2022. eVitroKhem. 2023; 2:67. https://doi.org/10.56294/evk202367
Submitted: 18-10-2022 Revised: 10-02-2023 Accepted: 26-07-2023 Published: 27-07-2023
Editor: Prof.
Dr. Javier Gonzalez-Argote ![]()
Corresponding Author: Rodrigo Dávid Colichón Carranza *
ABSTRACT
The particles (PM 2.5) contain a series of contaminants present on their surface, including minerals released into the environment and microplastics, among others, which affect air quality and people’s health. The objective of the study was to evaluate the impact of particulate matter (PM2.5) on atmospheric quality in the Morales district of the city of Tarapoto. The design was non-experimental, applied and cross-sectional. For this purpose, 10 sampling stations were considered where air samples were collected for the measurement of PM2.5 by gravimetry and the characterization of PM2.5 by scanning electron microscopy (SEM) and Fourier transform infrared spectroscopy analysis. (FTIR); Climatological measurements were also made, such as temperature, relative humidity, wind direction and speed, during a period of 10 days in the month of March 2022. The results indicated a range of PM2.5 between 71 µg/m3 (point: CA- 07) and 123 µg/m3 (point CA-10) and perfluorododecyl iodide type microplastic was identified, which suggests continuing with a monitoring program as an instrument to help control sources of pollution in the city.
Keywords: Microplastic; PM2.5; Meteorological Variables.
RESUMEN
Las partículas (PM 2.5) contienen una serie de contaminantes presentes en su superficie entre ellos los minerales desprendidos en el ambiente y microplásticos entre otros, estos afectan la condición del aire y la salud poblacional. El objetivo del estudio fue evaluar el impacto del material particulado (PM2.5) en la calidad atmosférica en el distrito Morales de la ciudad de Tarapoto. El diseño fue no experimental, de tipo aplicada y de nivel transversal. Se consideraron 10 estaciones de muestreo donde se colectaron muestras de aire para la medición de PM2.5 por gravimetría y la caracterización del PM2.5 mediante microscopía electrónica por barrido (SEM) y el análisis de espectroscopia infrarroja por transformada de Fourier (FTIR); también se hicieron mediciones climatológicas como dirección del viento, humedad relativa, temperatura y velocidad del viento, durante un periodo de 10 días en el mes de marzo del 2022. Los resultados indicaron un rango de PM2.5 entre 71 µg/m3 (punto: CA-07) y 123 µg/m3 (punto CA-10) y se identificaron micro plásticos de tipo yoduro de perfluorododecilo, lo cual sugiere continuar con un programa de monitoreo como un instrumento que ayude a controlar a las fuentes de contaminación de la ciudad.
Palabras clave: Microplástico; PM2.5; Variables Meteorológicas.
INTRODUCTION
Air pollution is one of the most critical environmental problems worldwide due to its harmful effects on human health and the environment.(1,2) Among the most dangerous pollutants is fine particulate matter (PM2.5), whose particles, with an aerodynamic diameter equal to or less than 2,5 micrometers, can penetrate deep into the respiratory system and cause respiratory and cardiovascular diseases, as well as increase the risk of premature mortality.(3) The World Health Organization (WHO) has established strict reference values for this pollutant, recommending a daily average of no more than 15 µg/m³ in order to protect public health. However, in many urban and peri-urban areas, actual concentrations often exceed these values by a wide margin, highlighting the urgent need for monitoring and control.(4,5)
In the national context, the district of Morales, located in the province of San Martín, has socioeconomic and geographical characteristics that favor the generation and accumulation of particulate matter. Among the most relevant activities contributing to PM2.5 emissions are vehicular transport, commercial activity, brick kilns, rice mills, and other anthropogenic practices. In addition, meteorological factors such as temperature, relative humidity, wind speed, and wind direction significantly influence the dispersion or accumulation of particles in the air.(6,7,8)
Despite the importance of this pollutant, there are few studies in the district of Morales that systematically analyze its levels and compare them with national and international standards. This lack of information limits decision-making and the implementation of effective public policies to improve air quality. In recent years, a new component of concern has been identified within particulate matter: microplastics. These particles, which are less than 5 mm in size, can be found suspended in the atmosphere and act as vectors for other chemical pollutants, amplifying the risks to health and the environment.(9,10,11,12,13)
In this context, this research aims to evaluate PM2.5 concentrations in the district of Morales during 2022, determining their relationship with meteorological parameters and comparing the results with the standards established by the WHO, the Environmental Quality Standard (ECA), and the National Air Quality Index (INCA).(14,15) Additionally, it seeks to identify the presence of microplastics in particulate matter, analyzing their characteristics and possible sources of emission. The aim is to provide scientific evidence that will serve as a basis for future strategies for control, mitigation, and awareness-raising among the population regarding the quality of the air they breathe.(16)
METHOD
Type of research
Given that sampling, recording, and analysis of digital data have already been carried out, the research takes a quantitative approach. This falls under the application category, as it is necessary to gather new knowledge. Propose an alternative solution. The type of sampling for this study is non-probability convenience sampling. It is based on observations because it has an ab initio design due to the lack of manipulation of variables and occurs naturally for subsequent analysis.
The level of research was descriptive cross-sectional because we focused on studying a little-researched problematic reality. No intervention was made in the design, and the level is descriptive because information was collected and the characteristics and properties were investigated in detail.
This research is applied because theoretical approaches to MP transport and its presence in the environment generated by various anthropogenic activities in the district of Morales (PM2.5) have been used. These have been applied in the sampling of particulate matter, which determined the existence of microplastics generated in the environment of the aforementioned district.
Variables and operationalization
The following variables were used for this research project:
Independent variable: Particulate matter (PM2.5)
Intervening variable: Weather conditions.
Dependent variable: Air quality.
|
Table 1. Impact of particulate matter (PM2.5) on air quality in the District of Morales – Province of San Martin – 2022 |
||||||||||
|
Problems |
Hypothesis |
Objective |
Variable |
Types of variables |
Definition |
Dimensions |
Indicators |
Scale |
||
|
Conceptual |
Operational |
|||||||||
|
Are concentrations of particulate matter 2,5 comparable with international reference values? |
Particulate matter 2,5 concentrations are not comparable with international reference values. |
Analyze concentrations of particulate matter 2,5 against international reference values. |
Particulate matter 2,5
|
Independent |
PM 2.5. These are very tiny particles suspended in the air, with a volume of 2,5 micrometers. Microplastics: Microplastics define particles (Thompson 2019) plastic particles ≤5 mm |
Both parameters will be measured with Air Quality Monitoring equipment for a duration of 24 hours per Point, in order to determine the concentration and presence of the parameters. |
PM2.5 concentration level |
PM 2.5 concentration |
Nominal |
|
|
Weather conditions |
Contributing |
Weather variables |
Temperature, relative humidity, wind speed and direction |
|||||||
|
Are the concentrations of particulate matter 2,5 comparable with national regulations? |
Particulate matter 2,5 concentrations are not comparable with national regulations |
Analyze the influence of particulate matter 2,5 concentrations on national regulations |
Air quality |
Dependent |
This reflects when the air is free of atmospheric pollutants and therefore suitable for breathing (INEI). |
Once the results have been obtained, in the case of particulate matter, we compare them with national regulations, and in the case of microplastics, we look at their presence and characteristics. |
International reference values |
WHO |
Nominal |
|
|
National regulations |
ECAs, INCA |
|||||||||
|
Are concentrations of particulate matter 2,5 comparable with international reference values? |
Particulate matter 2,5 concentrations are not comparable with international reference values. |
Analyze concentrations of particulate matter 2,5 against international reference values. |
Particulate matter 2,5 |
Independent |
PM 2.5. These are very tiny particles suspended in the air, with a volume of 2,5 micrometers. Microplastics: Microplastics define particles plastic particles ≤5 mm |
Both parameters will be measured with Air Quality Monitoring equipment for a duration of 24 hours per Point, in order to determine the concentration and presence of the parameters. |
PM2.5 concentration level |
PM 2.5 concentration |
Nominal |
|
|
Weather conditions |
Contributing |
Weather variables |
Temperature, relative humidity, wind speed and direction |
|||||||
|
Are the concentrations of particulate matter 2,5 comparable with national regulations? |
Particulate matter 2,5 concentrations are not comparable with national regulations |
Analyze the influence of particulate matter 2,5 concentrations on national regulations |
Air quality |
Dependent |
This reflects when the air is free of atmospheric pollutants and therefore suitable for breathing (INEI). |
Once the results have been obtained, in the case of particulate matter, we compare them with national regulations, and in the case of microplastics, we look at their presence and characteristics. |
International reference values |
WHO |
Nominal |
|
|
National regulations |
ECAs, INCA |
|||||||||
Population, sample, and sampling
Population
A set of accessible, limited, and defined cases that serve to represent the sample and meet several specific criteria (Arias, et al. 2019) is defined. It consists of the atmospheric columns present in the district of Morales, which are located two meters above the ground surface.
Sample
For Toledo, the sample represents the portion of the population under investigation that reflects conditions similar to those of the population as a whole. The samples were taken over 10 days during the month of March 2022. The samples obtained will depend on the relative humidity, wind direction, temperature, and flow velocity at the ten stations to be studied.
Air concentration formula
Calculation to obtain the volume of air absorbed by the PQ200 during the 24-hour sampling period:
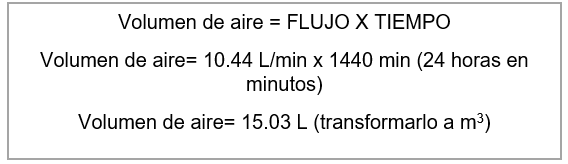
Figure 1. Formula
Sampling
This is the group of elements or units of the population studied that show probabilities other than zero. It will consist of 10 points designated in accordance with the National Protocol for Air Quality Monitoring.
Sampling method
For the sampling of PM2.5 particulate matter, the method described in the Peruvian Technical Standard (NTP 900,069-2017) was used, which describes the correct way to obtain the results. An electronic analytical balance (RADWAG) was used, purchased in Florida, United States, and calibrated annually in Peru, with a maximum weighing capacity of 5100 mg. Polytetrafluoroethylene (PTFE Teflon) filters with an integral support ring, circular diameter of (46,2 ± 0,25) mm, and thickness of (30 µm to 50 µm) were provided. To weigh the filters before and after monitoring, the laboratory uses the same equipment, in this case the analytical balance, to obtain accurate data without any variation. All filters are placed in a conditioned environment with a temperature of 20 °C – 23 °C. The balance used has a resolution of ±1 µg and is calibrated annually and recalibrated before each weighing. The analytical balance is located in the same controlled environment where the filters are conditioned, as the filters must be weighed immediately after the conditioning period (no less than 24 hours), without any intermediate explosions or other conditions or environments. With the results obtained for particulate matter (PM2.5) in g/filter, the results for particulate matter (PM2.5) were converted to µg/m3 by multiplying the results in the first table by the value (1 000 000).
Data collection techniques and instruments
According to a study, this step consists of collecting relevant data on the characteristics, perceptions, forms, and variables of the participants or subjects related to the research.
Data collection techniques
· Direct observation in the field.
· Georeferencing (UTM).
· Particulate matter sampling.
· Instrument validation and reliability.
These techniques mainly require manual filter changes every 24 hours in accordance with EPA 40 CFR. to Part 50, Items 6 and 8.
Data collection instruments
· Field data sheets
· Particulate matter collection filter
· Chain of custody
Procedure
The flow chart provided for the process of the impact of particulate matter (PM2.5) on air quality in the district of Morales is shown below.
Flowchart: Sampling process

Figure 2. Flowchart: Sampling process
The period during which the methods used to sample particulate matter (PM2.5) in the air quality of the Morales district were employed is shown below.
Research phases
Phase 1: identification of sampling points. The most critical areas of the study area were characterized using the direct observation method, in which 10 sampling points were determined in the areas most influenced by businesses, gas stations, shopping centers, brick factories, rice mills, and the vehicle fleet. These significantly influence the district of Morales due to their economic and productive characteristics.
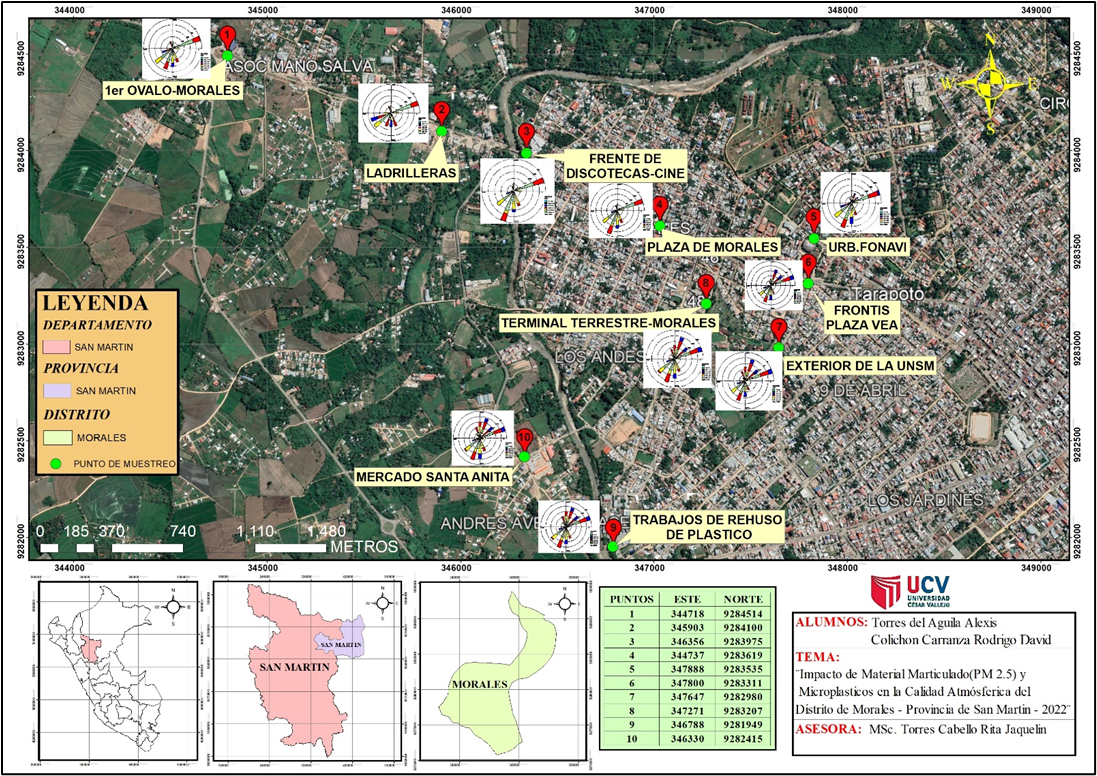
Figure 1. Map of the study area

Figure 2. Characterization of economic activities at the sampling sites
Phase 2: sampling and collection process Once the critical points were identified, they were geographically located using UTM coordinates with the help of a GPS.
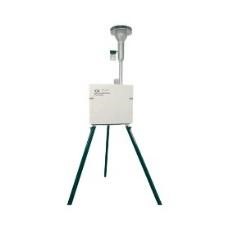
1. Air quality measurement equipment (LOW VOL) manufactured by ECOTECH and (PQ200) manufactured by Mesa Labs was installed. Both devices were assembled and calibrated in Peru with the corresponding filters for capturing PM2.5 and with a constant flow in accordance with national regulations, corresponding to a value of 10,44 L/min, and the weather station for wind strength and direction data.
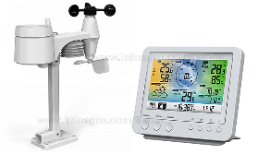
2. The weather station used is model FWS 20N, which contains sensors for measuring wind direction, wind speed, temperature, and relative humidity. This data was very useful in determining whether the aforementioned parameters influenced the measurement of microplastics and particulate matter.
The equipment operated 24 hours per point in accordance with DS No. 003-2017 MINAM with a constant flow of 10,44 L/m.
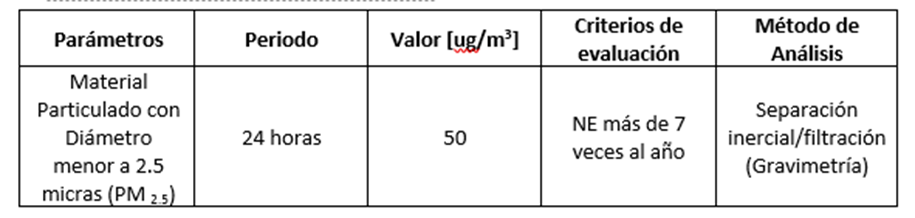
Figure 5. Air Quality Standard (ECA)


Figure 6. Sample collection
EPA 40 CFR Appendix L. to Part 50, the method provided is the (Reference Method used to determine PM2.5), This method indicates how to measure the mass concentrations of fine particles with a radius less than or equal to 2,5 micrometers in the air over a 24-hour period in order to determine whether the concentration complies with the specified national air quality and fine particle standards (National Institute for Occupational Safety & Health).
|
Table 2. Sampling Measures |
|
|
Chemical Agent |
Respirable dust/Microplastics |
|
Methodology |
EPA 40 CFR Appendix L. top art 50 |
|
Equip |
BGI (PQ200) |
|
Flow |
10,44 L/m |
|
Sampling period |
24 hrs |
An active sampler was used, and manual particle measurement methods were employed to ensure accuracy and safety.
|
Table 3. Materials and equipment used for particulate matter (PM2.5) measurement |
||||||
|
Equipment |
Brand |
Model |
Serial |
Function |
Image |
|
|
1 |
Particle Sampler |
MESA LABS |
BGI (PQ 200) |
285 |
Particulate Matter Sampler (PM10, PM2.5) with US EPA approval. |
|
|
1 |
37mm and 5 µm Teflon filters |
- |
- |
- |
Capture of particulate matter for subsequent analysis |
|
|
10 |
Cellulose filter holders |
- |
- |
- |
Cases to keep the filter in optimal condition |
|
|
1 |
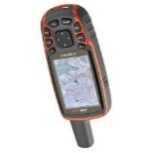
GPS |
GARMIN |
GPSMAP 64 S |
|
Provides information on the geographical location of the site. |
|
|
1 |
Weather Station |
PCE INSTRUMENT |
FWS 20N |
- |
It measures and records meteorological data to enable preventive action to be taken in response to changes in factors. |
|


Phase 3: the information obtained by the meteorological equipment was stored and the filters were carefully removed from the equipment and stored in cellulose filter holders for shipment and analysis at the laboratory. The same procedure was used at all 10 monitoring points once the monitoring period was complete.
The concentration of particulate matter will be analyzed by the gravimetric method, which consists of weighing the filter.
For the analysis of microplastics, the FTIR method was used, which consists of the use of infrared light.
Phase 4: we interpret the analyzed data. In the case of particulate matter, we look at the concentration at each monitoring point and compare it with the ECAs, LMPs, and WHO guidelines.
In the case of microplastics, after the corresponding analyses, we identify whether plastic particles are present, the size of the particles, and the type of plastic present, which allows us to determine their source.
Data analysis method
In the process of analyzing the data obtained in this research project, descriptive statistics are used in Excel to present the weather conditions (parameters).
Technical aspects
This research is based on integrity, responsibility, and respect for those who follow the principles established in the Code of Ethics set forth in Sectoral Resolution No. 0089-2019-UCV of the Cesar Vallejo University. Similarly, the use of Turnitin software to verify ownership and intellectual property upholds the principle of integrity.
RESULTS
The results obtained during the evaluation of particulate matter (PM2.5) in the district of Morales are shown in the following figures and tables concerning the objectives set.
Results of the calculation of particulate matter (PM2.5) obtained at the sampling sites.
Formula for determining the concentration of PM2.5 particulate matter absorbed by the PQ 200 equipment through the volume of air during the 24-hour sampling period.
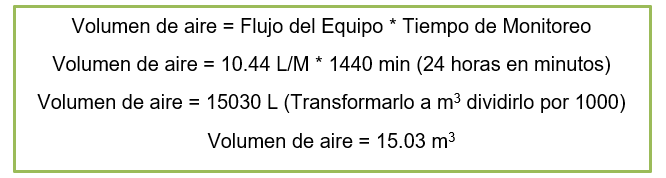
Figure 7. Formula
|
Table 4. Particulate Matter Results in g/filter |
|
|
CA-01 (1st Ovalo de Morales) |
0,001300 g/filter |
|
CA-02 (Brickworks) |
0,001791 g/filter |
|
CA-03 (Discotheque-cinema front) |
0,001132 g/filter |
|
CA-04 (Plaza de Morales) |
0,001077 g/filter |
|
CA-05 (Fonavi Urban Development) |
0,001165 g/filter |
|
CA-06 (Front of Plaza Vea) |
0,001542 g/filter |
|
CA-07 (Outside UNSM) |
0,001063 g/filter |
|
CA-08 (Morales Bus Terminal) |
0,001586 g/filter |
|
CA-09 (Plastic Recycling Works) |
0,001484 g/filter |
|
CA-10 (Santa Anita Market) |
0,001855 g/filter |
Calculation of PM2.5 concentration in µg/m3 at site CA-01
Concentration = weight (µg) – (multiply by 1,000,000) / air volume (m3)
Concentration = 1300 µg / 15,03 m3
Concentration = 86,4 µg/m3
Calculation of PM2.5 concentration in µg/m3 at site CA-02
Concentration = 1791 µg/ 15,03 m3
Concentration = 119,1mn µg/m3
Calculation of PM2.5 concentration in µg/m3 at site CA-03
Concentration = 1132 µg / 15,03 m3
Concentration = 75,3 µg/m3
Calculation of PM2.5 concentration in µg/m3 at site CA-04
Concentration = 1077 µg / 15,03 m3
Concentration = 72 µg/m3
Calculation of PM2.5 concentration in µg/m3 at site CA-05
Concentration = 1165 µg / 15,03 m3
Concentration = 78 µg/m3
Calculation of PM2.5 concentration in µg/m3 at site CA-06
Concentration = 1542 µg / 15,03 m3
Concentration = 103 µg/m3
Calculation of PM2.5 concentration in µg/m3 at site CA-07
Concentration = 1063 µg / 15,03 m3
Concentration = 71 µg/m3
Calculation of PM2.5 concentration in µg/m3 at site CA-08
Concentration = 1586 µg / 15,03 m3
Concentration = 106 µg/m3
Calculation of PM2.5 concentration in µg/m3 at site CA-09
Concentration = 1484 µg / 15,03 m3
Concentration = 99 µg/m3
Calculation of PM 2.5 concentration in µg/m3 at site CA-10
Concentration = 1855 µg / 15,03 m3
Concentration = 123,4 µg/m3.
Analyze particulate matter 2,5 concentrations against international reference values.
|
Table 5. Comparison of PM 2.5 particulate matter results, according to the WHO |
||
|
Monitoring points |
Final Values |
WHO Values |
|
CA-01 |
86,4 µg/m3 |
15 μg/m3 daily average |
|
CA-02 |
119,1 µg/m3 |
|
|
CA-03 |
75,3 µg/m3 |
|
|
CA-04 |
72 µg/m3 |
|
|
CA-05 |
78 µg/m3 |
|
|
CA-06 |
103 µg/m3 |
|
|
CA-07 |
71 µg/m3 |
|
|
CA-08 |
106 µg/m3 |
|
|
CA-09 |
99 µg/m3 |
|
|
CA-10 |
123,4 µg/m3 |
|

Figure 8. Final values at monitoring points compared to WHO values
Show the results obtained during the environmental monitoring of air quality in the district of Morales, referring to particulate matter (PM2.5), where the results from the sampling sites exceed the WHO standard of 15 ug/m3.
Analyze the influence of particulate matter 2,5 concentrations compared to national regulations.
|
Table 6. Comparison of particulate matter results according to ECA |
||
|
Monitoring Points |
Final Values |
ECA DS No. 003-2017-MINAM |
|
CA-01 |
86,4 µg/m3 |
50 µg/m3 over a 24-hour period |
|
CA-02 |
119,1 µg/m3 |
|
|
CA-03 |
75,3 µg/m3 |
|
|
CA-04 |
72 µg/m3 |
|
|
CA-05 |
78 µg/m3 |
|
|
CA-06 |
103 µg/m3 |
|
|
CA-07 |
71 µg/m3 |
|
|
CA-08 |
106 µg/m3 |
|
|
CA-09 |
99 µg/m3 |
|
|
CA-10 |
123,4 µg/m3 |
|

Figure 9. Final values at monitoring points compared to the ECA
Show the data obtained during environmental monitoring of air quality in the district of Morales, referring to particulate matter (PM2.5), where the results from the monitoring sites EXCEED the values established by Air Quality Standards (ECAS) DS No. 003-2017-MINAM, which sets a value of 50ug/m3.
|
Table 7. Comparison of Particulate Matter Results according to the Air Quality Index (INCA) |
||
|
Monitoring Points |
Final Values |
INCA-RM-No. 181-2016-MINAM |
|
CA-01 |
345,6 µg/m3 |
0 – 50 ug/m3 (GOOD) 51-100 ug/m3 (MODERATE) 101-500 ug/m3 (POOR) >500 (HEALTH ADVISORY LEVEL)
|
|
CA-02 |
476,4 µg/m3 |
|
|
CA-03 |
301,2 µg/m3 |
|
|
CA-04 |
288 µg/m3 |
|
|
CA-05 |
312 µg/m3 |
|
|
CA-06 |
412 µg/m3 |
|
|
CA-07 |
284 µg/m3 |
|
|
CA-08 |
424 µg/m3 |
|
|
CA-09 |
396 µg/m3 |
|
|
CA-10 |
493,6 µg/m3 |
|

Figure 10. PM2.5 particulate matter values using the Air Quality Index (INCA) formula
Show the results obtained during environmental monitoring of air quality in the district of Morales, referring to particulate matter (PM2.5), where the results from the monitoring points EXCEED the limits established by INCA RM-N°181-2016-MINAM, which sets permissible values of 0–50 ug/m3.
|
Table 8. Calculation of the Air Quality Index (INCA) |
||
|
Particulate Matter (PM2.5 ) 24-hour average |
||
|
INCA range |
Concentration range (ug/m3) |
Equation |
|
0 |
0 |
1(PM2.5)= [PM2.5)' 100/25 |
|
5 |
12,6 |
|
|
101 |
25,1 – 125 |
|
|
>500 |
>125 |
|
According to the values found in air monitoring by INCA, concentrations exceed the established limits, indicating that air quality is not optimal, as it is in the range of >125 ug/m3, which corresponds to the color brown (care threshold), indicating that pollutant concentrations affect the health of vulnerable populations.
Analyze the impact of particulate matter 2,5 on air quality in the District of Morales, Province of San Martín, 2022.

Figure 11. Particulate matter results at monitoring points
The concentration level of PM2.5 particulate matter in the samples. A value of 123,4 µg/m3 was obtained at the tenth sampling site (P10-M10), which was the highest concentration.
|
Table 9. Final average of meteorological variables |
|||||
|
Final Average of Meteorological Variables |
|||||
|
Station No. |
Temperature |
Relative Humidity |
Wind Speed (m/s) |
Wind Direction |
Sampling Dates |
|
CA-01 |
26,3 |
70,5 |
1,6 |
NNE |
14-03-2022 |
|
CA-02 |
26,5 |
65,5 |
2,4 |
SWW |
15-03-2022 |
|
CA-03 |
27,7°C |
70,5 |
1,6 |
NNE |
16-03-2022 |
|
CA-04 |
27,1 |
65,5 |
2,4 |
SW |
17-03-2022 |
|
CA-05 |
27,2 |
58,3 |
3,5 |
SSW |
18-03-2022 |
|
CA-06 |
27,5 |
59,9 |
4,5 |
SW |
19-03-2022 |
|
CA-07 |
26,8 |
68,3 |
1,9 |
SSE |
20-03-2022 |
|
CA-08 |
26,5 |
71,2 |
1,3 |
SE |
21-03-2022 |
|
CA-09 |
27,1 |
69,1 |
0,5 |
SWW |
22-03-2022 |
|
CA-10 |
27,7 |
62,5 |
0,5 |
SW |
23-03-2022 |
To verify the presence of particulate matter (PM2.5), meteorological parameters were analyzed on March 14, 15, 16, 17, 18, 19, 20, 21, and 23, 2022 (table 9).
|
Table 10. Average wind direction data |
||
|
Average wind direction |
||
|
CA-01 |
NNE |
22,5 degrees |
|
CA-02 |
SWW |
247,5 degrees |
|
CA-03 |
NNE |
22,5 degrees |
|
CA-04 |
SWW |
247,5 degrees |
|
CA-05 |
SSW |
202,5 degrees |
|
CA-06 |
SW |
225 degrees |
|
CA-07 |
SSE |
157,5 degrees |
|
CA-08 |
SE |
135 degrees |
|
CA-09 |
SWW |
247,5 degrees |
|
CA-10 |
SWW |
247,5 degrees |

Figure 12. Particulate matter (PM 2.5) concentration in relation to weather conditions in samples obtained during monitoring
According to these studies, the minimum climatic condition showed an average of 26,3 °C at monitoring point CA-01. The maximum temperature was at monitoring sites CA-03 and CA-10, where an average of 27,7 °C was obtained. The average relative humidity was 87,9 %. The minimum relative humidity was 78,4 %, while the maximum relative humidity was 97,1 %. The meteorological averages for wind direction are described. The prevailing wind directions during the monitoring period were SSW with 247,5 % at sites CA-02, CA-04, CA-09, and CA-10. This process was carried out using a wind rose, which is a hyperborean diagram that symbolizes the percentage of wind with the appropriate direction, with a simple observation on a graph where we will study the frequency and values of wind direction and speed.

Figure 13. Final average of meteorological variables in relation to temperature
Figure 13 shows the final average of the meteorological variables that were at the sampling sites, where the final average temperature was determined.

Figure 14. Final average of meteorological variables in relation to relative humidity
Figure 14 shows the final average of the meteorological variables in relation to relative humidity.

Figure 15. Final average of meteorological variables in relation to wind speed (m/s)
The final average wind speed (m/s) was also calculated for each sampling site (figure 15).


Figure 16. Wind rose
During air monitoring, meteorological monitoring was also carried out, with wind roses predominantly pointing northwest at the sampling points.
Characteristics of PM2.5
In this way, it was possible to identify the particularities of the particulate matter (PM 2.5) present in the air quality of the Morales district through scanning electron microscopy (SEM).
Figure 17 shows the particulate matter in the analysis sample at a microscopic level of 500x, where the transparent particles originating from PM 2.5 particulate matter can be distinguished.

Figure 17. Image of sample CA-01 under the microscope (500x)
In figure 18, the microscope magnification was increased to 1500x, revealing light-colored, proportionally shaped particulate matter particles.

Figure 18. Image of sample CA-01 under the microscope (1500x)
In figure 19, the microscope magnification was 5000x, clearly showing the particulate matter with a defined shape.

Figure 19. Image of sample CA-01 under the microscope (5000x)
The general composition of inorganic compounds is identified, presenting a composition of silicate minerals, vitreous material, wollastonite, aluminum oxide, iron, and particulate copper.
FTIR analysis results
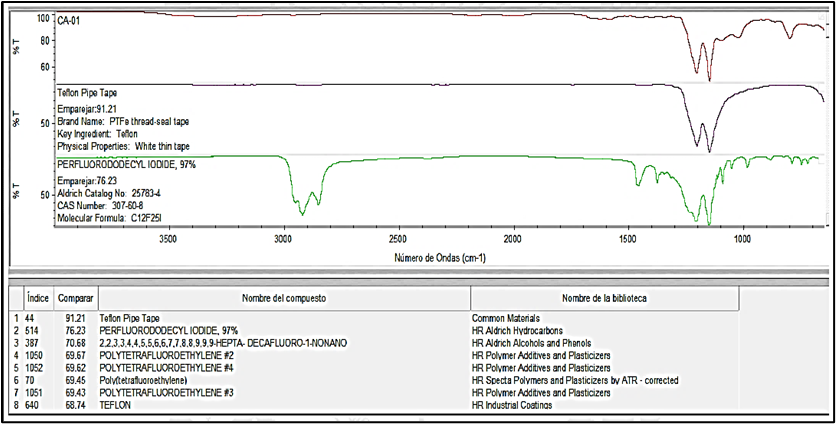
Figure 20. Analysis of microplastics at point CA-01
Interpretation: Regarding figure 20, an analysis was performed using FTIR (Fourier transform infrared spectroscopy) to identify the presence of microplastics. According to figure 20, elements of a certain plastic material were observed. For sample CA-01, the presence of perfluorododecyl iodide with wavelengths of 3343,58 cm-1 and 2966,80 cm-1 was demonstrated.

Figure 21. Analysis of microplastics at point CA-02
Interpretation: regarding figure 16, an analysis was performed using FTIR (Fourier transform infrared spectroscopy) to identify the presence of microplastics. According to Figure 16, elements of a certain plastic material such as polytetrafluoroethylene were identified, which could be assumed to be exposed at the peaks of the Teflon filter for sample CA-02. Therefore, the lack of data does not allow the identification of elements of a certain plastic material for the sample studied.

Figure 22. Analysis of microplastics at point CA-03
Interpretation: with regard to figure 22, an analysis was carried out using Fourier transform infrared spectroscopy (FTIR) to identify the presence of microplastics. According to figure 22, elements of certain plastic materials were identified, such as polytetrafluoroethylene, which could be assumed to be exposed at the peaks of the Teflon filter for sample CA-03. Therefore, the lack of data does not allow for the observation of elements of certain plastic materials for the sample.

Figure 23. Analysis of microplastics at point CA-04
Interpretation: with regard to figure 23, an analysis using Fourier transform infrared spectroscopy (FTIR) was used to identify the presence of microplastics. according to figure 23, elements of a certain plastic material were observed in sample CA-04, evidencing the existence of perfluorododecyl iodide with wavelengths of 1204,42 cm-1 and 1095,91 cm-1

Figure 24. Analysis of microplastics at point CA-05
Interpretation: in figure 24, Fourier transform infrared spectroscopy (FTIR) was used to identify the presence of microplastics. according to figure 24, elements of a certain plastic material were identified for sample CA-05, where the existence of perfluorododecyl iodide with wavelengths of 2969,75 cm-1 and 1212,43 cm-1 was evidenced.
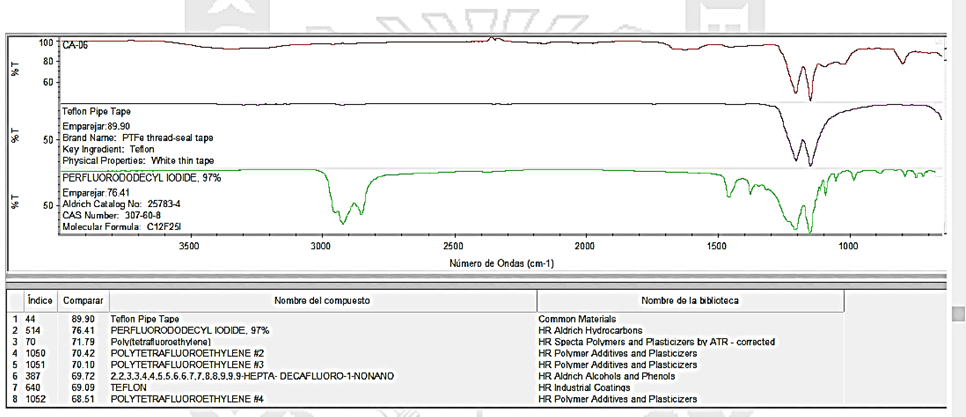
Figure 25. Analysis of microplastics at point CA-06
Interpretation: regarding figure 25, an analysis was performed using Fourier transform infrared spectroscopy (FTIR) to identify the presence of microplastics. According to figure 25, elements of a certain plastic material were observed. For sample CA-06, the presence of perfluorododecyl iodide with wavelengths of 1454,58 cm-1 and 1096,96 cm-1 was evidenced.

Figure 26. Analysis of microplastics at point CA-07
Interpretation: regarding figure 26, an analysis was performed using Fourier transform infrared spectroscopy (FTIR) to identify the presence of microplastics. According to figure 26, elements of a certain plastic material were observed. For sample CA-07, evidence of perfluorododecyl iodide with wavelengths of 2963,86 cm-1 and 1455,39 cm-1.

Figure 27. Analysis of microplastics at point CA-08
Interpretation: with regard to figure 27, using Fourier transform infrared spectroscopy (FTIR) to identify the presence of microplastics, according to figure 27, elements of a certain plastic material were identified for sample CA-08, where the existence of perfluorododecyl iodide was evidenced, with wavelengths of 2966,60 cm-1 and 1412,59 cm-1.

Figure 28. Analysis of microplastics at point CA-09
Interpretation: regarding figure 28, an analysis was performed using Fourier transform infrared spectroscopy (FTIR) to identify the presence of microplastics. According to figure 28, elements of a certain plastic material were observed in sample CA-09, the existence of perfluorododecyl iodide with wavelengths of 1149,09 cm-1 and 1103,52 cm-1 was evidenced.

Figure 29. Analysis of microplastics at point CA-10
Interpretation: with regard to figure 29, Fourier transform infrared spectroscopy (FTIR) was used to identify the presence of microplastics. according to figure 29, elements of a certain plastic material were identified. For sample CA-10, elements of a certain plastic material such as polytetrafluoroethylene were identified, which could be assumed to have been exposed at the peaks of the Teflon filter. For sample CA-10, the lack of data does not allow the identification of elements of a certain plastic material for the sample studied.
DISCUSSION
OE1: the values found during air quality monitoring in the Morales district at the 10 monitoring points show a maximum value of 123 ug/m3 at CA-10 and a minimum value of 71 ug/m3 at CA-07, values that EXCEED those established by the World Health Organization, which establishes a permissible concentration of 15 ug/m3. Similarly, a study monitored PM2.5 in Brazil and reported a maximum value of 60 mg/m3 evaluated over 24 hours, which is higher than the WHO reference (10 ug/m3-annual and 25 ug/m3-24 hours).(17,18,19,20,21,22) On the other hand, a WHO report indicates that air pollution is one of the 10 main threats to global health. Exposure to particulate matter (PM) is associated with the global burden of disease and non-accidental mortality.(23,24,25) For its part, the Institute for Health Effects mentions that environmental pollution by PM2.5 accounts for 62 % of all deaths attributable to air pollution and 55 % of disability-adjusted life years (DALYs) lost, i.e., 4,14 (95 % uncertainty interval [UI]: 2,50–3,36) million deaths and 118 (95 % UI: 95,9–138) million DALYs. Thus, for all the above reasons, it is clear that the PM2.5 particulate matter found at the points evaluated in the Morales district shows significant values that exceed the concentration established by the WHO, from which it can be deduced that the air quality is poor and that none of the points comply with the means to protect health, as it affects the vulnerable population, Since poor air quality exposes the population to acute and chronic diseases such as lung and cardiovascular diseases, cancer, pneumonia, bronchiolitis, and asthma, as evidenced in Mexico City by Matus and Oyarzun.(26,27,28,29,30,31) Peru has the lowest air quality in Latin America, ranking 26th (with 29,6 μg/m³) out of 117 countries. Chile ranks 40th (21,7 µg/m³), Mexico 51st (19,3 µg/m³), Colombia 72nd (14,1 µg/m³), and Brazil 75th (13,6 µg/m³), among others. The IQAir study evaluated air quality in 6,475 cities and 117 countries around the world based on the presence of particulate matter or PM2.5, according to the World Air Quality Report. In Peru, the most common diseases caused by air pollution are asthma, bronchitis, lung cancer, acute respiratory infections (ARI), and pneumonia. These diseases usually indicate that the mortality rate affects people under 5 and over 60, according to the National Center for Epidemiology, Prevention, and Disease Control of the Ministry of Health (figure 30).(35,36,37,38,39,40)
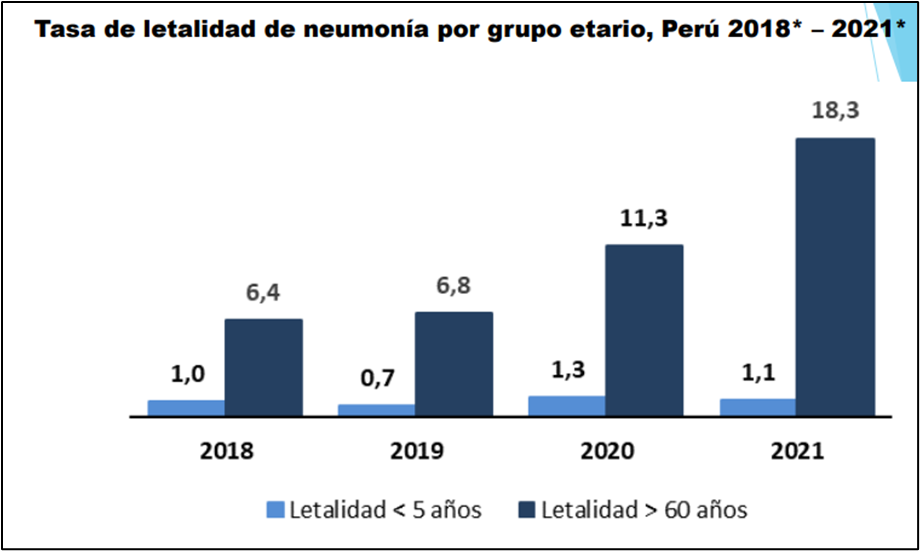
Figure 30. Pneumonia mortality rate by age group, Peru 2018-2021
Within the district of Morales, the rate of respiratory diseases in relation to PM2.5 particulate matter was found at the Morales health center (figure 31).

Figure 31. Rate of respiratory diseases per PM2.5 particulate matter at the Morales health center
SO2: analyze the influence of particulate matter 2,5 concentrations, compared to national regulations. in this case we refer to the INCA and ECA air regulations, in which we indicate that the concentrations at the 10 monitoring points in the district of Morales exceed the values according to ECA air DS-N° 003-2017-MINAM with a value of 50 ug/m3 in a 24-hour period. the values of our monitoring represent concentrations of 71 ug/m3 in CA-07 to 123,4 ug/m3 in CA-10, which is why we refer to a study, which indicates that exposure to PM2.5 would increase lung susceptibility, despite a gradual recovery of lung damage after cessation of exposure to PM2.5, demonstrating that PM2.5 can be easily inhaled and deposited in the trachea, bronchi, and even the alveoli, causing adverse effects on the respiratory system and function. A study measured PM2.5 in three cities in Peru (Tarapoto, Lima, and Juliaca), demonstrating that the city of Tarapoto has a concentration of 30,91 μg/m3 of PM2.5, Juliaca a concentration of 19,80 μg/m3, and Lima a value of 14,58 μg/m3, values that did not exceed the (ECA) of (50 μg.m3); Given the above and the results found in the investigation, we know that air quality is poor in the sampling areas and is bad for health, as the particles that enter through the nose or mouth settle in the respiratory tract, affecting the airways.(41,42,43,44,45)
With regard to the results according to INCA RM-N° 181-2016-MINAM, we found values that exceed the acceptable standard of 0 to 100 ug/m3 in the respective monitoring (CA-01, CA-02, CA-03, CA-04, CA-05, CA-06, CA-07, CA-08, CA-09, CA-10) show values of 345,6; 476,4; 301,2; 288; 312; 412; 284; 424; 396; 493,6 ug/m3, respectively, indicating that the air quality index in the district of Morales is very poor, as it exceeds the established concentration range of >125 ug/m3 according to INCA. It is classified as brown (threshold for concern), indicating that the concentrations of the pollutant affect the health of the vulnerable population. For his part, a study evaluated the air quality in the Huayco neighborhood in Tarapoto. The evaluation was carried out at two monitoring points over a period of one week in April, with the result of VERY POOR air quality according to the air quality index (INCA) at the first monitoring point and POOR at the second monitoring point.(46,47,48,49,50)
The Air Quality Index (AQI) helped us identify the degree of air pollution in relation to the health threat in the Morales district. The results obtained at stations CA-01, CA-02, CA-03, CA-04, CA-05, CA-06, CA-07, CA-08, CA-09, CA-10 were 360, 496,3, 313,8, 300,325, 429,2, 295,8, 441,7, 412,5, and 514,2 ug/m3, respectively, which indicates that pollution with respect to health is within the sixth range of the DANGEROUS category with concentrations above 250,5 ug/m3, which means a high risk of experiencing severe irritation and adverse health effects, and that everyone should avoid outdoor activities, as indicated in the following table of air pollutant limit concentrations according to the US EPA (table 11).(51,52,53,54)
|
Table 11. Air pollutant limit concentrations according to the US EPA |
|||
|
AQI score range |
AQI Category |
PM2.5 (μg/m³) |
Health risks |
|
0 |
Good |
0 |
Air quality is satisfactory and presents little or no risk. |
|
5 |
Moderate |
12,1 |
Sensitive individuals should avoid outdoor activity. |
|
101 |
Unhealthy for sensitive groups |
35,5 |
The general public and sensitive individuals in particular are at risk of risk of irritation and respiratory problems. |
|
151-200 |
Unhealthy |
55,5 |
Increased likelihood of adverse effects and aggravation of the heart and lungs among the general public. |
|
201 |
Very unhealthy |
150,5-250,4 |
The general public will be significantly affected. Sensitive groups should restrict outdoor activities. |
|
301 |
Dangerous |
250,5 |
The general public is at high risk of experiencing severe irritation and adverse health effects. Everyone should avoid outdoor activities. |
Meanwhile, a study in their research evaluated India's air quality in 240 cities with 342 monitoring stations. The air quality index (AQI) has been classified into different groups. To predict the AQI in the city of Chennai, the dataset was collected and then processed to replace missing values and remove redundant data, recording that the original dataset shows red for PM2.5 versus the AQI index value, indicating that the air quality is UNHEALTHY and that the population is exposed to adverse effects and aggravation of heart and lung conditions among the general public.(55,56,57,58)
Analyzing the Impact of Particulate Matter 2,5 on Air Quality in the District of Morales, Province of San Martín, 2022, indicates that meteorological parameters such as temperature, relative humidity, wind speed, and wind direction were evaluated in order to verify the presence of PM2.5 at each monitoring point. A study investigated PM2.5 in Sambalpur, finding values ranging from 36,38 to 64,00 µg/m3, indicating that it is above the annual limit set by the CPCB. Meanwhile, a study, in their research, monitored meteorological parameters where temperature ranged from 26,3 °C to 27 °C; relative humidity from 58,3 % to 71,2 %; wind speed from 0,5 m/s to 4,5 m/s with an average wind direction from 22,5 degrees to 247,5 degrees, in which the wind rose played a role in the dispersion and dilution of pollutants, in addition to being favored by the topography and anthropogenic activities in the area, where the highest average air temperature was recorded during the months of April (26,4 °C) and May (26,2 °C), and the lowest was (21,5 °C). A significant positive correlation between temperature and wind speed in our analysis reinforces this fact (r=+0,338, p<0,05).(59,60,61,62,63) The air quality in the area ranged from light to moderate air pollution, which is mainly attributed to particulate matter (PM2.5). Meanwhile, when analyzing the presence of microplastics, for sample CA-01, the presence of perfluorooctyl iodide with wavelengths of 3343,58 cm-1 and 2966,80 cm-1 was detected. For sample CA-02, no elements of a certain plastic material were identified. In sample CA-03, no elements of a certain plastic material were observed. For sample CA-04, the presence of perfluorodecyl iodide with wavelengths of 1204,42 cm-1 and 1095,91 cm-1 was detected. For sample CA-05, the presence of perfluorodecyl iodide with wavelengths of 2969,75 cm-1 and 1212,43 cm-1, in sample CA-06, the presence of perfluorodecyl iodide was detected with wavelengths of 1554,58 cm-1 and 1096,96 cm-1, in sample CA-07, the presence of perfluorodecyl iodide with wavelengths of 2963,86 cm-1 and 1455,39 cm-1 was detected in sample CA-08, where the presence of perfluorodecyl iodide with wavelengths of 2966,60 cm-1 and 1412,59 cm-1 was detected-1. Meanwhile, in sample CA-09, the presence of perfluorodecyl iodide was detected at wavelengths of 1149,09 cm-1 and 1103,52 cm-1. Finally, in sample CA-10, no plastic materials were detected. A study explored the distributions, compositions, and morphology of microplastics in indoor and outdoor air in New Jersey, United States. Microplastic fibers, films, and fragments of polystyrene (PS), polyethylene terephthalate (PET), polyvinyl chloride (PVC), polyethylene (PE), and polypropylene (PP) with similar textures but different sizes were identified in both total atmospheric deposition and particle samples (PM2.5). therefore these results reveal that the properties of airborne microplastics in urban environments are important for understanding their fate, transport, and potential health risks. Particles (PM2.5) and microplastics could act as carriers of polycyclic aromatic hydrocarbons (PAHs) that may increase the potential risk of cancer.(64,65,66)
CONCLUSIONS
OE1: the concentration of PM2.5 particulate matter at the 10 monitoring points in the Morales district, identifying plastic particles and different components present in the environment, concerning the PM2.5 parameter analyzed at the 10 monitoring points, comparing it with the WHO international standard of 15 µg/m3 daily average, The final values obtained exceed the established limits, with the maximum value at point CA-10 (Santa Anita Market) at 123,4 µg/m3 and the minimum value at point CA-07 (Outside UNSM) at 71 µg/m3.
OE2: comparison of the final PM2.5 results with the Quality Standards (ECA), which have a total value of 50 µg/m3, showed that the 10 monitoring points exceed the values established according to national standards, while according to the Air Quality Index (INCA) shows maximum values at station CA-10 with a value of 493,6 ug/m3 and minimum values at point CA-04 with a concentration of 288 ug/m3. It is therefore concluded that the breathable air in the district of Morales is within the Threshold for Care, as pollutant concentrations affect everyone's health and can have serious implications for vulnerable populations.
When evaluating meteorological parameters such as temperature, relative humidity, wind speed, and wind direction, their values varied according to the climatic factor. In addition, the stronger the wind, the more the PM2.5 concentrations can vary, since the wind carries suspended particles, thus influencing the concentrations of the samples. In addition, for the analysis of particulate matter, the scanning electron microscopy method was used at a scale of 500x, 1500x, and 5000x, which was an efficient tool for analysis as it identified the characteristics present, identifying aluminum oxide, glass material, iron, and particulate copper, concluding that the most abundant microplastic was perfluorododecyl iodide, which is an uncommon contaminant.
RECOMMENDATIONS
Future researchers are advised to conduct a more complex study of particulate matter, perhaps including the entire city of Tarapoto, in order to have a broader and more specific database on this parameter and to be able to determine the air quality conditions, given that the city is experiencing rapid population growth and the various activities that generate particulate matter may influence its production.
The three levels of government (national, regional, and local) should carry out monthly monitoring to determine the conditions to which the population is exposed when in contact with these pollutants, which are harmful to humans, as they can be detrimental to human health in the short or long term, since these pollutants often exceed Environmental Quality Standards (ECAS).
Finally, given the influence of the district and its high population, we recommend that municipalities implement awareness programs and mitigation plans to reduce airborne particles, which over time can cause chronic diseases not only in vulnerable populations but also in low-risk individuals.
BIBLIOGRAPHIC REFERENCES
1. Akhbarizadeh R, Dobaradaran S, Nabipour I, Tangestani M, Abedi D, Javanfekr F, et al. Suspended fine particulate matter (PM2.5), microplastics (MPs), and polycyclic aromatic hydrocarbons (PAHs) in air: Their possible relationships and health implications. Environ Res. 2021. https://doi.org/10.1016/j.envres.2020.110339
2. Sridharan S, Kumar M, Singh L, Bolan NS, Saha M. Microplastics as an emerging source of particulate air pollution: A critical review. J Hazard Mater. 2021. https://doi.org/10.1016/j.jhazmat.2021.126245
3. Wright SL, Ulke J, Font A, Chan KL, Kelly FJ. Development of screening criteria for microplastic particles in air and atmospheric deposition: critical review and applicability towards assessing human exposure. Microplast Nanoplast. 2021 Apr 17;1(1):6. https://doi.org/10.1186/s43591-021-00006-y
4. Liu C, Li J, Zhang Y, Wang L, Deng J, Gao Y, et al. Widespread distribution of PET and PC microplastics in dust in urban China and their estimated human exposure. Environ Int. 2019. https://doi.org/10.1016/j.envint.2019.04.024
5. Oroumiyeh F, Zhu Y. Brake and tire particles measured from on-road vehicles: Effects of vehicle mass and braking intensity. Atmos Environ (1994). 2021. https://doi.org/10.1016/j.aeaoa.2021.100121
6. Kelly FJ, Fussell JC. Toxicity of airborne particles—established evidence, knowledge gaps and emerging areas of importance. Philos Trans A Math Phys Eng Sci. 2020. https://doi.org/10.1098/rsta.2019.0322
7. Evangeliou N, Grythe H, Klimont Z, Heyes C, Eckhardt S, Lopez-Aparicio S, et al. Atmospheric transport is a major pathway of microplastics to remote regions. Nat Commun. 2020. https://doi.org/10.1038/s41467-020-17201-9
8. Provencher JF, Ammendolia J, Rochman CM, Mallory ML. Proceed with caution: The need to raise the publication bar for microplastics research. Sci Total Environ. 2020. https://doi.org/10.1016/j.scitotenv.2020.141426
9. Gasperi J, Wright SL, Dris R, Collard F, Mandin C, Guerrouache M, et al. Microplastics in air: Are we breathing it in?. Curr Opin Environ Sci Health. 2018. https://doi.org/10.1016/j.coesh.2017.10.002
10. Zhang Y, Kang S, Allen S, Allen D, Gao T, Sillanpää M. Atmospheric microplastics: A review on current status and perspectives. Earth Sci Rev. 2020. https://doi.org/10.1016/j.earscirev.2020.103118
11. Rushingabigwi G, Yang W, Xin J, Zhao H, Guo L. Analysis of the atmospheric dust in Africa: The breathable dust's fine particulate matter PM2.5 in correlation with carbon monoxide. Atmos Environ (1994). 2020. https://doi.org/10.1016/j.atmosenv.2020.117319
12. Liang L, Gong P, Wu L, Liu X, Li H. Calibrating low-cost sensors for ambient air monitoring: Techniques, trends, and challenges. Environ Res. 2021. https://doi.org/10.1016/j.envres.2021.111163
13. Wright SL, Ulke J, Font A, Chan KL, Kelly FJ. Atmospheric microplastic deposition in an urban environment and an evaluation of transport. Environ Int. 2020. https://doi.org/10.1016/j.envint.2019.105411
14. Prata JC, da Costa JP, Lopes I, Duarte AC, Rocha-Santos T. The importance of contamination control in airborne fibers and microplastic sampling: Experiences from indoor and outdoor air sampling in Aveiro, Portugal. Mar Pollut Bull. 2020 Oct;159:111522. doi:10.1016/j.marpolbul.2020.111522.
15. Ebrahimi P, Kalantari N, Farrokhi M, Nasiri M, Zarei M, Fazlzadeh M. Investigating impact of physicochemical properties of microplastics on human health: A short bibliometric analysis and review. Chemosphere. 2022 Feb;289:133146. doi:10.1016/j.chemosphere.2021.133146.
16. Ye Y, Zhang Y, Chen Y, Han X, Ren H. The development and application of advanced analytical methods in microplastics contamination detection: A critical review. Sci Total Environ. 2022 Apr 20;818:151851. doi:10.1016/j.scitotenv.2021.151851.
17. Yao Y, Glamoclija J, Rojanasakul Y, Castranova V, Brooks BW, He K. Characterization of microplastics in indoor and ambient air in northern New Jersey. Environ Res. 2022 May;207:112142. doi:10.1016/j.envres.2021.112142.
18. Abbasi S, Keshavarzi B, Moore F, Turner A, Kelly FJ, Dominguez AO, et al. Distribution and potential health impacts of microplastics and microrubbers in air and street dusts from Asaluyeh County, Iran. Environ Pollut. 2019 Jan;244:153-164. doi:10.1016/j.envpol.2018.10.039.
19. Gasperi J, Wright SL, Dris R, Collard F, Mandin C, Guerrouache M, et al. Microplastics in air: Are we breathing it in? Curr Opin Environ Sci Health. 2018 Feb;1:1-5. doi:10.1016/j.coesh.2017.10.002.
20. Beaurepaire M, Dris R, Gasperi J, Tassin B. Microplastics in the atmospheric compartment: a comprehensive review on methods, results on their occurrence and determining factors. Curr Opin Food Sci. 2021 Oct;41:159-168. doi:10.1016/j.cofs.2021.04.010.
21. Daiber A, Kuntic M, Oelze M, Abou-El-Ardat K, Steven S, Schulz E, et al. Effects of air pollution particles (ultrafine and fine particulate matter) on mitochondrial function and oxidative stress – Implications for cardiovascular and neurodegenerative diseases. Arch Biochem Biophys. 2020 Dec 15;696:108662. doi:10.1016/j.abb.2020.108662.
22. Huang Y, He B, Yang T, Chen Z, Shi J. Mini-review on current studies of airborne microplastics: Analytical methods, occurrence, sources, fate and potential risk to human beings. TrAC Trends Anal Chem. 2020 Apr;125:115821. doi:10.1016/j.trac.2020.115821.
23. Prata JC. Airborne microplastics: Consequences to human health? Environ Pollut. 2018 Mar;234:115-126. doi:10.1016/j.envpol.2017.11.043.
24. Fan C, Wu H, Zeng G, Li H, Zhou Y, Wang Z, et al. Microplastic constituent identification from admixtures by Fourier-transform infrared (FTIR) spectroscopy: The use of polyethylene terephthalate (PET), polyethylene (PE), polypropylene (PP), polyvinyl chloride (PVC) and nylon (NY) as the model constituents. Environ Technol Innov. 2021 Aug;23:101798. doi:10.1016/j.eti.2021.101798.
25. Stockin KA, Orams MB, Bollard B, Ventre K, Wiseman N, Moore MJ, et al. Fourier transform infrared (FTIR) analysis identifies microplastics in stranded common dolphins (Delphinus delphis) from New Zealand waters. Mar Pollut Bull. 2021 Dec;173:113084.: https://doi.org/10.1016/j.marpolbul.2021.113084
26. Hopke PK, Dai Q, Li L, Feng Y. Global review of recent source apportionments for airborne particulate matter. Sci Total Environ. 2020 Oct 20;740:140091. [citado 2022 Feb 22]. Disponible en: https://doi.org/10.1016/j.scitotenv.2020.140091
27. Liao Z, Ji X, Ma Y, Lv B, Huang W, Zhu X, et al. Airborne microplastics in indoor and outdoor environments of a coastal city in Eastern China. J Hazard Mater. 2021. https://doi.org/10.1016/j.jhazmat.2021.126007
28. Akdogan Z, Guven B. Microplastics in the environment: A critical review of current understanding and identification of future research needs. Environ Pollut. 2019. https://doi.org/10.1016/j.envpol.2019.113011
29. Correia Prata J, da Costa JP, Lopes I, Duarte AC, Rocha-Santos T. Environmental exposure to microplastics: An overview on possible human health effects. Sci Total Environ. 2020. https://doi.org/10.1016/j.scitotenv.2019.134455
30. Rahman A, Sarkar B, Yadav OP, Achari G, Slobodnik J. Potential human health risks due to environmental exposure to nano- and microplastics and knowledge gaps: A scoping review. Sci Total Environ. 2021. https://doi.org/10.1016/j.scitotenv.2020.143872
31. Urrutikoetxea-Gutiérrez M, García-García B, Alonso ML, Marimón JM. Ultra-fast direct method for identifying microorganisms from BACTEC lytic/10 anaerobic/F flasks. Future Microbiol. 2021. https://doi.org/10.2217/fmb-2021-0059
32. Rahman L, Mahmudur Rahman S, Rakib MR, Jho Y, Lee S, Park J, et al. Microplastics and nanoplastics science: collecting and characterizing airborne microplastics in fine particulate matter. Nanotoxicology. 2021. https://doi.org/10.1080/17435390.2021.2018065
33. Peñalver R, Borrull F, Pocurull E, Marcé RM. Assessing the level of airborne polystyrene microplastics using thermogravimetry-mass spectrometry: Results for an agricultural area. Sci Total Environ. 2021. https://doi.org/10.1016/j.scitotenv.2021.147656
34. Habibi N, Kazemi SM, Shams M. Microplastics in the atmosphere: a review. J Environ Expo Assess. 2022. https://doi.org/10.20517/jeea.2021.07
35. Xie Y, Chen J, Li J, Zhang Y, Guo Y, Zhao Y, et al. Inhalable microplastics prevails in air: Exploring the size detection limit. Environ Int. 2022. https://doi.org/10.1016/j.envint.2022.107151
36. Uddin S, Fowler SW, Saeed T, Al-Ghadban AN, Al-Shamroukh D, Zaki N, et al. A preliminary assessment of size-fractionated microplastics in indoor aerosol—Kuwait’s baseline. Toxics. 2022. https://doi.org/10.3390/toxics10020071
37. Su L, Nan B, Hassell KL, Craig NJ, Pettigrove V. Temporal and spatial variations of microplastics in roadside dust from rural and urban Victoria, Australia: Implications for diffuse pollution. Chemosphere. 2020;252:126567. doi:10.1016/j.chemosphere.2020.126567
38. Torres-Agulló A, Karanasiou A, Moreno T, Lacorte S. Overview on the occurrence of microplastics in air and implications from the use of face masks during the COVID-19 pandemic. Sci Total Environ. 2021;800:149555. doi:10.1016/j.scitotenv.2021.149555
39. Hu K, Gong M, Feng S, Gao S, Zhou J, Zhu L, et al. Emerging microplastics in the environment: Properties, distributions, and impacts. Chemosphere. 2022;297:134118. doi:10.1016/j.chemosphere.2022.134118
40. Luo Z, Mai L, Li H, Liu Y, Zhang D, Wong CS, et al. Environmental occurrence, fate, impact, and potential solution of tire microplastics: Similarities and differences with tire wear particles. Sci Total Environ. 2021;795:148902. doi:10.1016/j.scitotenv.2021.148902
41. Szewc K, Graca B, Dołęga A. Atmospheric deposition of microplastics in the coastal zone: Characteristics and relationship with meteorological factors. Sci Total Environ. 2020;143272. doi:10.1016/j.scitotenv.2020.143272
42. Liu K, Wang X, Fang T, Xu P, Zhu L, Li D. Source and potential risk assessment of suspended atmospheric microplastics in Shanghai. Sci Total Environ. 2019;675:462-71. doi:10.1016/j.scitotenv.2019.04.110
43. Kole PJ, Löhr AJ, Van Belleghem FGAJ, Ragas AMJ. Wear and tear of tyres: A stealthy source of microplastics in the environment. Int J Environ Res Public Health. 2017;14(10):1265. doi:10.3390/ijerph14101265
44. Amato-Lourenço LF, Carvalho-Oliveira R, Júnior GR, dos Santos Galvão L, Ando RA, Mauad T. Airborne microplastics and SARS-CoV-2 in total suspended particles in the area surrounding the largest medical centre in Latin America. Environ Pollut. 2022;292:118299. doi:10.1016/j.envpol.2021.118299
45. Ljubimova JY, Braubach O, Patil R, Chumakova A, Chen Z, Kleinman MT, et al. Coarse particulate matter (PM2.5–10) in Los Angeles Basin air induces expression of inflammation and cancer biomarkers in rat brains. Sci Rep. 2018;8(1):5708. doi:10.1038/s41598-018-23885-3
46. Amato-Lourenço LF, dos Santos Galvão L, de Weger LA, Hiemstra PS, Vijver MG, Mauad T. An emerging class of air pollutants: Potential effects of microplastics to respiratory human health? Sci Total Environ. 2020;749:141676. doi:10.1016/j.scitotenv.2020.141676
47. Abbass RA, Kumar P, El-Gendy A. Car users exposure to particulate matter and gaseous air pollutants in megacity Cairo. Sustain Cities Soc. 2020;56:102090. doi:10.1016/j.scs.2020.102090
48. Chen G, Feng Q, Wang J. An overview of analytical methods for detecting microplastics in the atmosphere. TrAC Trends Anal Chem. 2020;130:115981. doi:10.1016/j.trac.2020.115981
49. Cooper DM, Loxham M. Particulate matter and the airway epithelium: the special case of the underground? Eur Respir Rev. 2019;28(153):190066. doi:10.1183/16000617.0066-2019
50. Chen Y, Wild O, Conibear L, Ran L, He J, Wang L, et al. Local characteristics of and exposure to fine particulate matter (PM2.5) in four Indian megacities. Atmos Environ X. 2020;5:100052. doi:10.1016/j.aeaoa.2019.100052
51. Guo C, Zhang Z, Lau AKH, Lin CQ, Chuang YC, Chan J, et al. Long-term exposure to ambient fine particulate matter (PM2.5) and lung function in children, adolescents, and young adults: a longitudinal cohort study. Environ Health Perspect. 2019;127(12):127008. doi:10.1289/EHP5220.
52. Sarkodie SA, Owusu PA, Leirvik T. Proximate determinants of particulate matter (PM2.5) emission, mortality and life expectancy in Europe, Central Asia, Australia, Canada and the US. Sci Total Environ. 2019;683:489-97. doi:10.1016/j.scitotenv.2019.05.278.
53. Zhou T, Zhong Y, Hu Y, Sun C, Wang Y, Huang Z, et al. Fine particulate matter (PM2.5) aggravates apoptosis of cigarette-inflamed bronchial epithelium in vivo and in vitro. Environ Pollut. 2019;248:1-9. doi:10.1016/j.envpol.2018.11.054.
54. Shamsipour M, Hassanvand MS, Goudarzi G, Idani E, Gharibzadeh S, Naddafi K, et al. National and sub-national exposure to ambient fine particulate matter (PM2.5) and its attributable burden of disease in Iran from 1990 to 2016. Environ Pollut. 2019;255:113173. doi:10.1016/j.envpol.2019.113173.
55. Singh V, Singh S, Biswal A. Exceedances and trends of particulate matter (PM2.5) in five Indian megacities. Sci Total Environ. 2021;750:141461. doi:10.1016/j.scitotenv.2020.141461.
56. Chen R, Yin P, Meng X, Liu C, Wang L, Xu X, et al. Associations between coarse particulate matter air pollution and cause-specific mortality: a nationwide analysis in 272 Chinese cities. Environ Health Perspect. 2019;127(1):017008. doi:10.1289/EHP2711.
57. Wang Q, Yuan X, Yang J, Li C, Zhang K, Li J, et al. The impacts of urbanization on fine particulate matter (PM2.5) concentrations: empirical evidence from 135 countries worldwide. Environ Pollut. 2019;247:989-98. doi:10.1016/j.envpol.2019.01.086.
58. Bai Y, Sun Q. Fine particulate matter air pollution and atherosclerosis: mechanistic insights. Biochim Biophys Acta Gen Subj. 2016;1860(12):2863-8. doi:10.1016/j.bbagen.2016.04.030.
59. Velasquez RMA, Romero YL, Noel J. Citizen science approach for spatiotemporal modelling of air pollution quality and traffic in Lima, Peru. In: 2019 IEEE Sciences and Humanities International Research Conference (SHIRCON). IEEE; 2019. doi:10.1109/SHIRCON48091.2019.9024879.
60. European Respiratory Society. Clean air for healthy lungs – an urgent call to action: European Respiratory Society position on the launch of the WHO 2021 Air Quality Guidelines. Eur Respir J. https://erj.ersjournals.com/content/58/6/2102447
61. Siciliano B, Carvalho G, Arbilla G. The updated Brazilian national air quality standards: a critical review. J Braz Chem Soc. 2020;31(3):523-35. doi:10.21577/0103-5053.20190212.
62. Sahu C, Sahu SK. Ambient air quality and air pollution index of Sambalpur: a major town in Eastern India. Int J Environ Sci Technol. 2019;16(12):8217-28. doi:10.1007/s13762-019-02383-7.
63. Xue T, Geng G, Meng X, Xiao Q, Zheng Y, Gong J, et al. New WHO global air quality guidelines help prevent premature deaths in China. Natl Sci Rev. 2022;9(4):nwac055. doi:10.1093/nsr/nwac055.
64. Zaib S, Lu J, Bilal M. Características espacio-temporales del índice de calidad del aire (ICA) en el noroeste de China. Atmósfera. 2022;13(3):375. doi:10.3390/atmos13030375.
65. Heidarinejad Z, Alidadi H, Aghayani E, Esmaeili A. Data on evaluation of AQI for different seasons in Kerman, Iran, 2015. Data Brief. 2018;20:1917-23. doi:10.1016/j.dib.2018.08.216.
66. Tan X, Han L, Zhang X, Zhou W, Li W, Qian Y. A review of current air quality indexes and improvements under the multi-contaminant air pollution exposure. J Environ Manag. 2021;279:111681. doi:10.1016/j.jenvman.2020.111681.
FINANCING
None.
CONFLICT OF INTEREST
The authors declare that there is no conflict of interest.
AUTHORSHIP CONTRIBUTION
Conceptualization: Rodrigo Dávid Colichón Carranza, Alexis Torres-del Aguila, Carlos Mauricio Lozano Carranza, Andi Lozano Chung.
Data curation: Rodrigo Dávid Colichón Carranza, Alexis Torres-del Aguila, Carlos Mauricio Lozano Carranza, Andi Lozano Chung.
Formal analysis: Rodrigo Dávid Colichón Carranza, Alexis Torres-del Aguila, Carlos Mauricio Lozano Carranza, Andi Lozano Chung.
Writing – original draft: Rodrigo Dávid Colichón Carranza, Alexis Torres-del Aguila, Carlos Mauricio Lozano Carranza, Andi Lozano Chung.
Writing – review and editing: Rodrigo Dávid Colichón Carranza, Alexis Torres-del Aguila, Carlos Mauricio Lozano Carranza, Andi Lozano Chung.