doi: 10.56294/evk2024102
REVIEW
Application of simulation tools to HAZOP analysis of exothermic reaction processes
Aplicación de herramientas de simulación al análisis HAZOP en procesos con reacción exotérmica
Oswaldo A. Azuaje G1, Andrés Rosales1, Francisco Da Silva1
1Universidad Central de Venezuela, Facultad de Ingeniería, Escuela de Ingeniería Química. Caracas, Venezuela.
Cite as: Azuaje GOA, Rosales A, Da Silva F. Application of simulation tools to HAZOP analysis of exothermic reaction processes. eVitroKhem. 2024; 3:102. https://doi.org/10.56294/evk2024102
Submitted: 06-06-2023 Revised: 23-09-2023 Accepted: 19-12-2023 Published: 01-01-2024
Editor: Prof.
Dr. Javier Gonzalez-Argote ![]()
ABSTRACT
Introduction: the article addressed the integration between process simulation and HAZOP studies as a tool for risk analysis in the chemical industry. It was identified that, despite the effectiveness of traditional HAZOP, its qualitative nature and dependence on expert judgment limited its scope in complex systems. In response, it was proposed to review the use of simulation - in steady state and dynamic - as a support to improve the identification and evaluation of deviations in industrial processes, especially in CSTR type reactors.
Development: the principles of chemical process simulation and its application using tools such as Aspen HYSYS were described. The advantages of mathematical modeling for predicting the behavior of a system in the face of disturbances were analyzed. In particular, a case of propylene glycol production in a CSTR reactor was studied, highlighting the influence of parameters such as temperature, reactant flow and unstable operating zones. Key concepts of the HAZOP study, the LOPA methodology and the design of protection layers were reviewed and linked to data obtained from detailed simulations. Visual tools such as bifurcation diagrams and operational windows were exemplified.
Conclusions: the review evidenced that the use of simulation strengthens risk analyses by complementing the HAZOP approach with quantitative data. This combination improved the accuracy of the analysis, reduced the study execution time and increased the reliability of the results. It was concluded that the integration of advanced simulators represents a key trend in the evolution towards more digitized and efficient risk management.
Keywords: HAZOP; Dynamic Simulation; CSTR Reactor; Risk Analysis; Operational Windows.
RESUMEN
Introducción: el artículo abordó la integración entre simulación de procesos y estudios HAZOP como herramienta para el análisis de riesgos en la industria química. Se identificó que, a pesar de la efectividad del HAZOP tradicional, su carácter cualitativo y dependiente del juicio experto limitaba su alcance ante sistemas complejos. En respuesta, se planteó revisar el uso de simulación —en estado estacionario y dinámico— como apoyo para mejorar la identificación y evaluación de desviaciones en procesos industriales, especialmente en reactores tipo CSTR.
Desarrollo: se describieron los principios de la simulación de procesos químicos y su aplicación mediante herramientas como Aspen HYSYS. Se analizaron las ventajas del modelado matemático para prever el comportamiento de un sistema frente a perturbaciones. Particularmente, se estudió un caso de producción de propilenglicol en un reactor CSTR, destacando la influencia de parámetros como temperatura, flujo de reactivos y zonas de operación inestable. Asimismo, se revisaron conceptos clave del estudio HAZOP, la metodología LOPA y el diseño de capas de protección, vinculándolos con datos obtenidos de simulaciones detalladas. Se ejemplificaron herramientas visuales como diagramas de bifurcación y ventanas operacionales.
Conclusiones: la revisión evidenció que el uso de simulación fortalece los análisis de riesgos al complementar el enfoque HAZOP con datos cuantitativos. Esta combinación permitió mejorar la precisión del análisis, reducir el tiempo de ejecución del estudio y elevar la confiabilidad de los resultados. Se concluyó que la integración de simuladores avanzados representa una tendencia clave en la evolución hacia una gestión de riesgos más digitalizada y eficiente.
Palabras clave: HAZOP; Simulación Dinámica; Reactor CSTR; Análisis de Riesgos; Ventanas Operacionales.
INTRODUCTION
Modern industrial processes, particularly in the chemical industry, are exposed to a wide range of risks due to demanding operating conditions, complex interactions between systems, and the possibility of human or mechanical failure. For this reason, risk analysis has become essential for ensuring safety, operational efficiency, and environmental protection.
Among the most widely used techniques for hazard assessment is HAZOP (Hazard and Operability Study) analysis, which has been widely adopted in the process industry for its ability to identify operational deviations and propose preventive measures. However, its traditional application can be time-consuming and overly dependent on the subjective experience of the technical team.
In recent years, the integration of process simulation tools—steady-state and dynamic—has begun to transform how risks are assessed. These simulations allow for more accurate and early analysis of the behavior of complex systems, supporting safety analysis from the design stage onwards.
Objective
To explore the current state of simulation use in the context of HAZOP studies, emphasizing applications relevant to the design and operation of CSTR-type reactors with exothermic reactions.
Various methodological approaches, recent case studies, and computational tools are analyzed to evaluate the advantages, limitations, and opportunities for improvement in the integration of simulation and risk analysis.
DEVELOPMENT
Process Simulation
Chemical process simulation uses a mathematical model that calculates mass and energy balances coupled with phase equilibrium and chemical transport and kinetic equations. The aim is to predict the behavior of a process with a known structure, in which some of the preliminary data on the equipment involved is also known, to evaluate a process's performance and prevent failures within it. The process analysis is based on a mathematical model consisting of equations that relate the process variables (temperatures, pressures, flows, and compositions) to design variables such as surface areas and geometric configurations. The mathematical models used in process simulations contain linear, nonlinear, and differential equations representing equipment, physicochemical properties, connections between equipment, process operations, and specifications.(1)
Process simulations are performed using commercial process simulators. A process simulator is simply a computer program used to model the behavior of a chemical process. Process simulators allow you to:
· Predict the behavior of a process.
· Simultaneously analyze different cases by changing the values of the primary process variables.
· Optimize the operating conditions of existing or new plants.
· Monitor a plant throughout its useful life to anticipate process expansions or improvements.
Steady-state simulation
Steady-state simulation consists of solving a previously described mathematical model without involving the time variable. The process is said to operate in a steady state (or permanent regime) when the properties of the flows remain unchanged over time.(2) Nonlinear algebraic equations usually express this behavior.
Dynamic Simulation
On the other hand, dynamic simulation consists of solving the mathematical model of the system under study, including the time variable in the analysis. In contrast to the steady state, in the dynamic mode, the process variables change over time.(2) In this case, the mathematical model will consist of a system of ordinary differential equations whose differential variable is time. Through dynamic simulation, it is possible to monitor the behavior of the main variables of the process by including control systems and their response to disturbances typical of the regular operation of an industrial plant in the analysis.
Process Description
The production process of propylene glycol is based on the hydrolysis reaction of propylene oxide. Figure 1 shows a basic diagram of the process studied.

Figure 1. Basic diagram of the propylene glycol production process from propylene oxide(3)
As can be seen in the diagram, the process starts with the corniche entry of the Corrientes raw materials into the mixer. This equipment mixes the propylene oxide, water, and a water-rich recirculation stream. The propylene oxide stream, water, and a water-rich recirculation stream obtained later in the process are mixed in this equipment. It should be noted that the propylene oxide stream often has a considerable amount of methanol in its composition before entering the process. Methanol is added to the mixture to improve the solubility between propylene oxide and water.(1) This process consists of two stages: the reaction and separation. The reaction stage occurs once the mixer's outlet stream enters the reactor. A schematic of the reaction used in figure 2 shows a scheme of the reaction commonly used in producing propylene glycol.

Figure 2. Scheme of the hydrolysis reaction of propylene oxide(4)
Hydrolysis occurs in a continuously stirred tank reactor (CSTR) at atmospheric pressure. As the reaction is exothermic, it is necessary to maintain the reactor temperature at 60°C by using a cooling water stream. At this temperature, obtaining between 90-98 % conversion in the reaction is possible. Once the reaction is complete, a mixture of propylene glycol, water, methanol, and, to a lesser extent, propylene oxide is obtained. In the separation stage, a distillation column separates the propylene glycol from the other components, which begins when the column receives the effluent stream from the reactor. A fraction of the current leaving the top of the column is recirculated to the mixer to increase the conversion in the reaction. In this way, extracting the propylene oxide that remained unreacted is also possible using a purge stream.(3) Finally, the bottom stream of the column contains propylene glycol, which is the product of interest. As the bottom stream leaves the column at an elevated temperature, it is then sent to a heat exchanger to reduce its temperature before storing the product in the tank.
Case study: Reactor design conditions, control system, and safety
The case study data were taken from the primary reference justifying the execution of this work.(5) The inlet temperature of the reactants is 26°C. The reaction is carried out in a reactor with a volume of 2 m3 at a pressure of 2000 KPa. The standard operating molar flow rates are 10 mol/s for oxide and 6 mol/s for water. The reactor has a cooling jacket, water with a flow rate of 150 mol/s, and a temperature of 15°C is used as cooling fluid. The cooling system's overall heat transfer coefficient per transfer surface area (i.e., UA) is 7000 W/°C. Figure 3 shows a simplified process flow diagram of the equipment to carry out the hydrolysis reaction of propylene oxide.

Figure 3. Simplified flow diagram of the reactor used for the hydrolysis reaction of propylene oxide
The main objective of the reactor operation is to obtain propylene glycol with a water conversion greater than 90 % at the outlet. The feed conditions could change if production requirements are updated within the plant or unexpected failures occur. In these cases, the output parameters, especially the temperature, may fluctuate, leading to dangerous consequences due to multiple steady states. Concerning the safe operation of the equipment, the reactor temperature must not exceed 97°C, as temperatures above this limit may cause evaporation of the reactant mixture. Crossing this limit is wholly unacceptable and can lead to serious incidents within the plant. To prevent such a situation and maintain the desired reagent conversion, reactor temperature control is incorporated into the process as the first layer of protection. In this control loop, the temperature is the controlled variable, and the cooling water flow is the manipulated variable. The typical feedback control strategy is used. Although the simplified process flow diagram does not show them, the reactor must also have flow controllers for the reactants and a liquid level controller inside the vessel.
Process Safety Analysis
Risk analyses in process plants are designed to improve facility safety conditions by reducing risks and applying measures to prevent accidents and any damage to personnel, equipment, and the environment involved in the process under analysis. These analyses are based on the application of all types of standards, laws, codes, and algorithms concerning the field of industrial safety, in addition to the implementation of risk analysis methods such as the fault tree (FTA), HAZOP, HAZID, HAZAN, among others.(6) The design of safety systems in process plants requires a risk assessment using some process hazard analysis (PHA) method. The PHA to be implemented should be adjusted to the complexity of the process; if the process is complex, a HAZOP study should be used, while for less complex processes, a less rigorous method should be used, such as checklists, failure mode, and effects analysis (FMEA) or fault tree.(7)
Layer of Protection Process Analysis (LOPA)
Layers of protection analysis (LOPA) is a risk management technique commonly used in the process industry that can provide a more detailed semi-quantitative assessment of the risks and layers of protection associated with hazardous scenarios. LOPA analysis identifies the scenarios that present the most significant risk and determines whether the consequences can be reduced by applying inherently safer design principles.(8)
Process Protection Layers
The design and operation of a process plant can have a safety instrumented system to ensure safe working conditions for plant personnel, the integrity of equipment and facilities, compliance with environmental regulations, and adequate measures to handle potential emergencies.
The concept most commonly used in process design to project a robust safety system is based on providing multiple layers of protection. Typical layers of protection include the process design, the basic process control system, and the alarm system, among others. The layers must be designed to activate each of them if the previous one has failed in its purpose.(9) Figure 4 shows the layers of protection that typically make up the safety system of a process plant.

Figure 4. Process Protection Layers(9)
Process Design
The most basic layer of protection is the safe design of the process and equipment. Incidents are much less likely to occur if the process is inherently safe. Similarly, since the process equipment is the primary means of handling the processed chemicals, as well as the high pressures and temperatures, the design of the equipment must be capable of withstanding deviations in operating conditions while maintaining stable and safe operation to avoid compromising the integrity of the facility or other equipment.
Basic Process Control System (BPCS)
The function of the basic process control system is to keep the plant operating under safe conditions of temperatures, pressures, flows, levels, and compositions. The process control system must maintain the process within reasonable limits and be close to steady-state operation. To fulfill its mission, the system must have the necessary controllers and adequate control strategies to ensure that the product is obtained with the required quantity and quality, in addition to safeguarding the operators' safety and the equipment's integrity.
Hazard Analysis and Operability in Process Plants (HAZOP)
The HAZOP study is a formal procedure used to identify hazards in facilities where chemical processes occur. The procedure has proven effective in identifying hazards and is well-accepted by the chemical industry. In this method, the basic idea is to allow the mind to think freely, yet in a controlled manner, and to consider all possible ways in which operational or process failures could occur. Before starting the HAZOP study, all detailed process information must be available; this includes the latest updates of process flow diagrams (PFDs), piping and instrumentation diagrams (P&IDs), equipment specifications, materials of construction, and mass and energy balances.(7) A multidisciplinary team of experienced professionals from different areas elaborates on the HAZOP study. They meet periodically to analyze a process and determine the causes of deviations that may occur within it. Figure 5 shows a model of a table used in HAZOP studies.

Figure 5. Typical model of a usable table for a study HAZOP(10)
A HAZOP study's fundamental objective is to examine a process's entire design to detect deviations in operating conditions and process interactions that could lead to hazardous situations or operability problems. These include the following:
· Dangers to the safety or health of personnel.
· Damage to equipment or facilities.
· Damage to the environment.
· Dangers during plant startup and shutdown.
· Problems to operate or to perform maintenance.
· Alterations on product quality.
· Parada unforeseen (emergency) plant.
Node
When applying the HAZOP method, nodes are sections into which the piping and instrumentation diagram of a plant is divided, to be studied individually. This facilitates the identification of hazardous circumstances in some regions of the process.
Generally, a node is leading equipment, a pipe section, or functionally interconnected equipment and pipe sections.(10)
There are two types of nodes:
· Nodos process: each node groups lines and equipment, analyzing the evolution of the process using operating conditions.
· Nodos global: these nodes cover all the facilities subject to the HAZOP study. They are used to perform "pipeline to pipeline" analysis, trying to identify circumstances external to the process (implementation, leaks, etc.) that may lead to the occurrence or development of accident situations.
Node selection is critical in the application of HAZOP since it has been shown that incorrect node selection negatively impacts the study's outcome. To prevent possible errors in the interpretation of the extension, nodes should be numbered and clearly and unambiguously defined. In addition, the necessary references to the equipment, valves, and main lines associated with each node should be included.
Parameter
Parameters are the process variables to be bypassed (temperature, pressure, flow, level, etc.) in a HAZOP study.(10)
Guiding Word
The HAZOP method procedure systematically uses a series of guidewords to divert the selected process parameters. In practice, and especially in continuous processes, the analysis is represented almost exclusively by a small group of standardized guidewords.(10) The meaning of the most frequently used guide words about the deviation they produce in a parameter are shown in the following table.
|
Tabla 1. Most used guide words in the HAZOP method |
||
|
Guiding Words |
||
|
Obligatorias |
||
|
English |
Español |
Meaning |
|
No |
No/Sin |
Negation of the intention to diseño |
|
More |
Más |
Quantitative increase of a process parameter(whose value can be measured by means of an instrument) |
|
Less |
Menos |
From quantitative increase of a process parameter (whose value can be measured by means of an instrument) |
|
Other than |
Otro |
Alternative substitution ormodification in the parameter usedparameter used |
|
Reverse |
Inverso |
Opuesto a la direccióo ncess planned orcontrary to the choice programada |
|
Optionales |
||
|
Inglés |
Español |
Meaning |
|
As well as |
Además de |
Increase or qualitative modification |
|
Part of |
Parte de |
Decrease or qualitative change |
Deviation
Deviations are generated by combining the guide words with the process parameters:
Guidance word + Parameter = Deviation
The generated deviations must be realistic and consistent with the study. Some of these combinations may be unrealistic for specific processes or nodes, so do not waste time with them. Since not all combinations of parameters and guide words are compatible, it is necessary to consider the incompatibilities of some guide words with some process parameters when generating deviations.(10) The following table specifies the guide words that may be applied to the main parameters that must be analyzed:
|
Table 2. Guiding words that can be applied to the main parameters of the process |
|||||
|
Guide word Parameter |
No/Sin (No) |
Más (More) |
Menos (Less) |
Inverso (Reverse) |
Otro (Other than) |
|
Level |
|
x |
x |
|
|
|
Flow |
x |
x |
x |
x |
|
|
Pressure |
|
x |
x |
|
|
|
Temperature |
|
x |
x |
|
|
|
Composition |
|
|
|
|
x |
|
Service |
x |
|
|
|
|
|
Containment |
x |
|
|
|
|
Cause
The most critical part of a HAZOP study is determining the causes of process parameter deviations since this is what must be acted upon first. Design and/or assembly failures should not be considered in this determination.(10)
Three basic types of causes should be analyzed:
· Failures of equipment or instruments.
· Human failures.
· External events.
Scenario
A scenario is a dangerous situation generated by a deviation in a process, which can cause damage if it develops completely and without control.(10)
Consequence
The consequences are the damages that can be generated by the scenario if it develops completely into an accident (fire, explosion, toxic dispersion, etc.).(10)
Safeguard
A safeguard is an action designed to prevent the causes or counteract the consequences of deviations.
Multiplicity of steady states
Multiple steady states appear when an exothermic reaction is carried out in the operation of CSTR-type reactors. To verify the existence of the multiplicity of steady states, the mass and energy balances in the reactor must be solved graphically. When there is more than one intersection between the mass and energy balance curves, a set of conditions that satisfy both balances is presented, and for this reason, multiple steady states are produced in which the reactor can operate. The following image is extracted from the bibliography to exemplify this definition.

Figure 6. Diagram of multiple steady states(4)
Multi-steady-state diagram
The multi-steady-state diagram is a graph in which the numerous operating points found for a CSTR reactor with exothermic reaction can be visualized. This diagram generally shows the reactor temperature as a function of the reactant inlet temperature or the inlet flow. This diagram also shows the ignition and quenching points, representing very particular conditions within the reactor operation. Ignition appears when the reactor temperature rises suddenly with a slight change in the disturbed variable; this is a link point in which it passes from a lower steady state to a higher steady state, while extinction leads to a sudden drop in the operating temperature of the equipment, through this link the reactor passes from a higher state to a lower one. An example of this diagram is shown in the following figure.

Figure 7. Diagram of multiple steady states, as a function of reagent inlet temperature(4)
Out of control in a CSTR reactor
In many reactor systems, the operation can be undesirable or even dangerous if the temperature rises above a particular point. With elevated reactor temperature, unwanted side reactions may occur, and in other cases, evaporation of the reactants may occur. This situation is known as decontrol (although this is also the ignition point described in the previous section). Graphically, the flash point is said to be reached when the heat-removed curve moves away from the point of tangency concerning the heat-generated curve. A graphical representation of the decontrol can be seen in the following figure:

Figure 8. Out of control in a CSTR(4)
Reactor Stability Diagram
The stability diagram of a CSTR-type reactor shows the regions of stable and unstable operation of the reactor. To develop this diagram, composite variables must be used; these are variables that, in turn, have a dependence on other variables of the reaction process that are commonly known and can be measured directly, such as the heat transfer coefficient and area, the heat capacity and the feed flow of the mixture, the temperature of the feed and that of the cooling fluid, in addition to the kinetic data of the reaction. An example of such a diagram can be seen in the following figure.

Figure 9. Stability diagram of a CSTR(4)
Operational window
The operational windows of equipment represent the safe operating limits for the variables of a process so that if any of the variables deviate from these limits for a given period while the process is in progress, the integrity of the equipment can be severely affected. In process design, an important objective is to ensure that the specified ranges of operating conditions can be satisfactorily achieved. To meet that objective, it is necessary to perform an analysis in which key decisions are made regarding the process, such as the type of process, its structure, and the capacity of the equipment, in addition to determining the best values for the key process variables that will allow the plant to achieve the required conditions. The result of this analysis should be a design that can be kept operating within the safe zones of the operational windows of the equipment.(11) Operational windows are generally represented graphically, and within process analysis, it is essential to be familiar with them and know how to use them properly. In the case of CSTR-type reactors with exothermic reaction, a diagram containing the temperature curve as a function of the variable to be evaluated (in the case of this work, the propylene oxide flow), as well as specific characteristic points related to the reactor operation, can be assumed as the operating window. An example of an operating window for this equipment is shown below:

Figure 10. Operational window of a CSTR reactor(4)
In the graph shown, the ignition and extinction points are represented by the black-filled dots, the Hopf bifurcation points by the white circles, and the reactor's normal operating point by the white square.
Stable, steady states
In steady states, the reactor temperature remains stable from startup for as long as the reactor is in operation. Likewise, if a disturbance occurs after a short period, the reactor temperature can stabilize again at one of these points.
Unstable states
In the unstable zone, the reactor temperature presents a great vulnerability to any disturbance that may occur within the process; it can suddenly jump to a higher or lower value very easily. These points are located between the ignition and extinction points.(12,13)
If the process's requirements warrant it, a stringent controller can be used to operate at one of these points. The stability of the different steady states can be analyzed by plotting the curves of heat generated and heat removed as a function of temperature and finding the temperatures of the intersection points between the two curves. The figure below, taken from the literature, shows an example of the graph commonly used to determine whether the steady states found are stable or unstable.(14,15)

Figure 11. Multi-temperature stability diagram(4)
Oscillating states
The temperature does not reach a steady state in oscillating states over time. These states are the least desirable for the operation of the equipment since they can more easily lead to an out-of-control situation.
Establishment of HAZOP deviations
Following the base methodology of this study,(5) once the operational window of the reactor has been constructed, the normal operating point of the reactor must be selected, as well as the values of the deviations of increase and decrease of the propylene oxide flow, in such a way that using the dynamic simulation the unstable and oscillating states that are reached when introducing the deviations are observed, to identify the safe operating zones for the equipment.
Diagram of families of steady-state solutions
A family of curves for the reactor temperature can be obtained by superimposing the reactor temperature for different cooling water flows. A graphical representation of this family of curves can be seen in the following figure:

Figure 12. Diagram of steady state solutions for various cooling water flows(5)
Bifurcation diagram
The Hopf bifurcation diagram is a graphical representation in which curves of the Hopf bifurcation points, ignition and extinction curves are included, as well as the initial and final points of the reactor operation from start-up to the end of a certain period of time after introducing disturbances, and the effects of these disturbances and the actions of the controllers. Also included is the identification of stability, instability, and oscillating zones. An example of the Hopf bifurcation diagram is shown in the figure below:
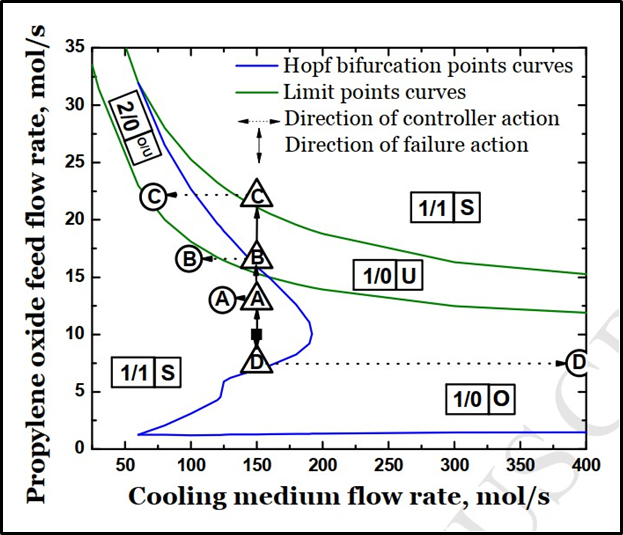
Figure 13. Hopf bifurcation diagram(5)
At this point, it is essential to point out that this diagram represents the curve shown in the reactor stability diagram (figure 9) as the dark green curves. These green curves represent the ignition and extinction points. On the other hand, the blue curve represents the Hopf bifurcation points.
CONCLUSIONS
This review article has highlighted the importance of integrating simulation tools with traditional risk analysis methods, particularly with the HAZOP study, within the field of chemical process engineering. In this context, the fundamental role of simulation -both steady-state and dynamic- in predicting the behavior of complex systems and in the early identification of hazardous operating conditions has been highlighted.
The application of simulations allows a more accurate representation of the real operation of process equipment, as is the case of the continuously stirred tank reactor (CSTR), which is widely used in industrial processes with exothermic reactions. These simulations not only provide detailed information on key variables such as temperature, pressure, and flow but also make it possible to anticipate critical phenomena such as the appearance of multiple steady states, unstable or oscillating zones, and ignition or extinction points that could not be easily detected with exclusively qualitative methods.
The complementary use of dynamic models in HAZOP studies represents a significant improvement over the conventional approach, as it enables a more realistic assessment of operational deviations, the associated consequences, and the effectiveness of implemented safeguards. In particular, methodologies based on dynamic simulation, such as those developed by Janosovsky(12), allow for delimiting safe operational windows and constructing bifurcation diagrams that enrich the analysis basis of the multidisciplinary team responsible for the risk study.
In addition, the paper has exposed how analysis tools such as LOPA and protection layer design can benefit from data derived from detailed simulations, thus improving the quality of safety decision-making.
In conclusion, incorporating advanced simulators such as Aspen HYSYS into HAZOP analysis offers a promising way to modernize process safety engineering. This integration not only reduces the uncertainty associated with expert judgment but can also decrease study execution time, increase the reliability of the results, and contribute significantly to the safe, stable, and efficient operation of chemical plants. As the industry progresses towards digitization, combining traditional methods and simulation technologies will establish itself as an essential practice in modern industrial risk management.
BIBLIOGRAPHIC REFERENCES
1. Gil I, Guevara J, García J, Leguizamón A, Rodríguez G. Process Analysis and Simulation in Chemical Engineering. Springer; 2016. 10.1007/978-3-319-14812-0.
2. Arce E. La simulación como herramienta de desarrollo en la Ingeniería Química. 1995. https://www.academia.edu/2043783/La_simulación_como_herramienta_de_desarrollo_en_la_Ingeniería_Química.
3. Hernández E. Diseño de un caso base de una planta de producción de Glicol de Propileno. Matanzas: Universidad de Matanzas “Camilo Cienfuegos”; 2012. http://cict.umcc.cu/repositorio/tesis/Trabajos%20de%20Diploma/Ingeniería%20Química/2012/Diseño%20de%20un%20caso%20base%20de%20una%20planta%20de%20producción%20de%20Glicol%20de%20Propileno%20(Edel%20Hernández%20Bustos).pdf.
4. Fogler HS. Elementos de ingeniería de las reacciones químicas. 4th ed. Pearson Prentice Hall; 2008.
5. Danko M, Janosovsky J, Labovsky J, Jelemensky L. Integration of process control protection layer into a simulation-based HAZOP tool. J Loss Prev Process Ind. 2019. https://doi.org/10.1016/j.jlp.2018.12.006.
6. Pereira J. Análisis de riesgos en una planta de compresión utilizando como herramienta la simulación del proceso. Trabajo Especial de Grado. Universidad Central de Venezuela; 2016.
7. Crowl DA, Louvar JF. Chemical Process Safety: Fundamentals with Applications. 2nd ed. Prentice Hall; 2002.
8. Willey R. Layer of Protection Analysis. Procedia Eng. 2014;84:835–43. DOI: 10.1016/j.proeng.2014.10.405.
9. Petróleos de Venezuela, S.A. (PDVSA). Manual de Ingeniería de Riesgos: PDVSA IR-S-01, Filosofía de Diseño Seguro. Venezuela; 2010.
10. Ibarra J. Guía para la realización de estudios HAZOP (HAZard and OPerability analysis) 2007 https://www.academia.edu/29813154/GUÍA_PARA_LA_REALIZACIÓN_DE_ESTUDIOS_HAZOP_HAZard_and_OPerability_analysis.
11. Marlin T. Teaching Operability in Undergraduate Chemical Engineering Design Education. 2007. DOI: 10.18260/1-2--1502.
12. Janosovsky J, Danko M, Labovsky J, Jelemensky L. Development of a Software Tool for Hazard Identification Based on Process Simulation. Chem Eng Trans. 2019. https://doi.org/10.3303/CET1977059.
13. Danko M, Janosovsky J, Labovsky J, Labovska Z, Jelemensky L. Use of LOPA Concept to Support Automated Simulation-Based HAZOP Study. Chem Eng Trans. 2018;67:283–8. https://doi.org/10.3303/CET1867048.
14. López J, Méndez S. Validación de un estudio HAZOP realizado mediante la metodología tradicional usando la simulación del proceso. Trabajo Especial de Grado. Universidad Central de Venezuela; 2023.
15. Maraima Y. Metodología para estudios de peligros de procesos en la seguridad funcional de una planta típica de compresión, haciendo uso del Digital Twin de la planta. Trabajo Especial de Grado. Universidad Central de Venezuela; 2022.
16. Zhang J, Zhang L, Hu J, Lind M, Zhang X, Jørgensen SB, et al. An integrated qualitative and quantitative modeling framework for computer-assisted HAZOP studies. AIChE J. 2014. DOI: https://doi.org/10.1002/aic.14593.
FINANCING
The authors did not receive funding for the development of this research.
CONFLICT OF INTEREST
The authors declare that there is no conflict of interest.
AUTHORSHIP CONTRIBUTION
Conceptualization: Oswaldo A. Azuaje G, Andrés Rosales, Francisco Da Silva.
Data curation: Oswaldo A. Azuaje G, Andrés Rosales, Francisco Da Silva.
Formal analysis: Oswaldo A. Azuaje G, Andrés Rosales, Francisco Da Silva.
Research: Oswaldo A. Azuaje G, Andrés Rosales, Francisco Da Silva.
Methodology: Oswaldo A. Azuaje G, Andrés Rosales, Francisco Da Silva.
Project Management: Oswaldo A. Azuaje G, Andrés Rosales; Francisco Da Silva
Resources: Oswaldo A. Azuaje G, Andrés Rosales, Francisco Da Silva.
Software: Oswaldo A. Azuaje G, Andrés Rosales, Francisco Da Silva.
Supervision: Oswaldo A. Azuaje G, Andrés Rosales, Francisco Da Silva.
Validation: Oswaldo A. Azuaje G, Andrés Rosales, Francisco Da Silva.
Visualization: Oswaldo A. Azuaje G, Andrés Rosales, Francisco Da Silva.
Writing - original draft: Oswaldo A. Azuaje G, Andrés Rosales, Francisco Da Silva.
Writing - proofreading and editing: Oswaldo A. Azuaje G, Andrés Rosales, Francisco Da Silva.